
paschal Amarachi
Data Analyst
About Me
Hi, I’m Paschal Amarachi, a Data Analyst who thrives on uncovering hidden patterns and transforming data into strategic business decisions.I’ve built regression models that forecast key business metrics, designed dashboards that simplify decision-making.Whether its optimizing sales, identifying growth opportunities, or improving financial processes, I help businesses stay ahead with data-driven strategies.
Skills

Excel | Power BI | SQL | Python
Featured Projects
PIZZA SALES ANALYSISPower BI
Using Power BI, I built an interactive dashboard to track sales. The insights reveal key opportunities for boosting revenue, optimizing promotions, and enhancing customer engagement.
STRIKERS PERFORMANCE PREDICTIONPython
This project dives into a dataset of 500 strikers to uncover patterns, insights, traits that separate the best from the rest and help coaches make better decisions for their team.
PERSONAL FINANCE TRACKERExcel
This project is a personal finance dashboard I created entirely in Microsoft Excel, from data analysis to visual design. It’s a clean and intuitive tracker built to visualize income, spending habits, and transaction behavior over the year. The goal was to better understand personal cash flow and enable smarter, more intentional financial decisions.
PIZZA SALES ANALYSISPower BI
Project Overview
This project was an exciting deep dive into pizza sales data using Power BI to uncover key trends in revenue, customer preferences, and sales performance. The dataset contained information on orders, pizza categories, sizes, and sales trends. I aimed to build an interactive dashboard that provides clear, data-driven insights to support business decisions.Data Cleaning & Preparation
✅ Merged Data for a Holistic View – Combined multiple tables to create a unified dataset.
✅ Checked for Duplicates & Errors – Ensured data integrity for accurate reporting.
✅ Defined Data Types – Converted columns to appropriate formats for smooth calculations and visuals.Dashboard Development
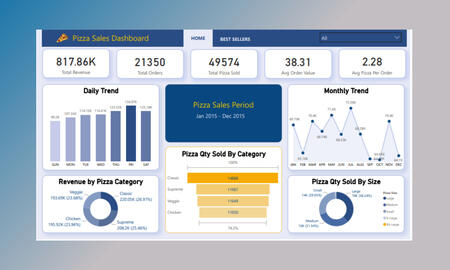
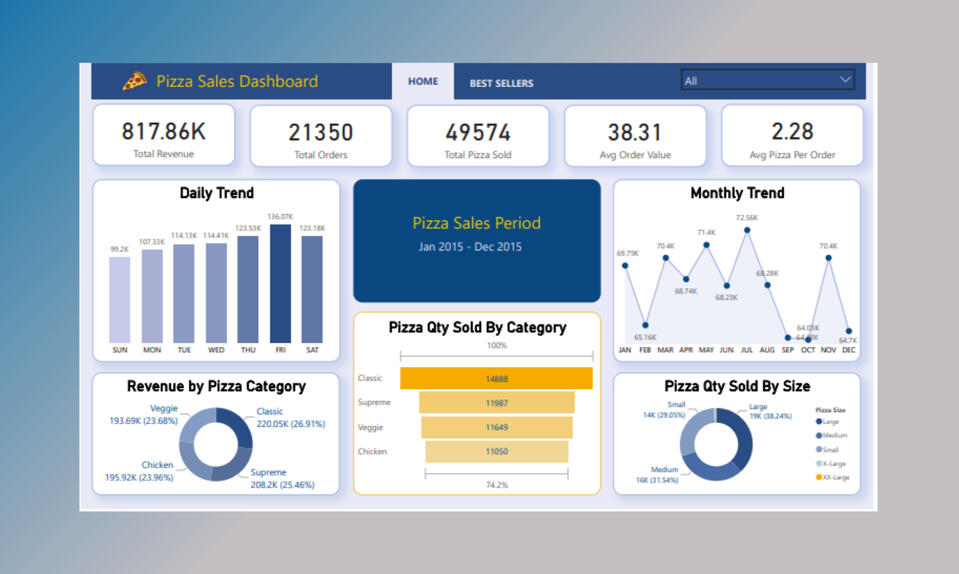
Creating a visually engaging and interactive dashboard was my favorite part. I designed it to highlight key performance indicators (KPIs) and sales trends at a glance.🌸 Key Metrics Display: Showcased total revenue ($817.86K), total orders (21,350), total pizzas sold (49,574), and average order value ($38.31).
🌸 Daily & Monthly Trends: Tracked pizza sales fluctuations across days of the week and months of the year.
🌸 Revenue by Pizza Category: Analyzed which pizza categories (Veggie, Classic, Chicken, Supreme) contributed the most to sales.
🌸 Pizza Quantity Sold by Category & Size: Identified top-selling pizza types and the most preferred sizes (Small, Medium, Large, X-Large).
🌸 Slicers for Interactivity: Allowed users to filter by pizza category, size, and time period for deeper insights.KEY INSIGHTS DISCOVERED
📌 Classic Pizzas led in sales, with 14,888 pizzas sold, making them the most popular choice.
📌 Revenue was highest from Classic pizzas ($220.05K), followed by Supreme ($208.2K).
📌 Fridays and Saturdays had the highest sales, indicating strong weekend demand.
📌 July and December had the highest monthly sales spikes, highlighting peak demand periods.
📌 Large-sized pizzas were the most preferred, contributing to 38.24% of total pizzas sold.WHAT I'D DO NEXT
✅ Promote Classic & Supreme Pizzas: These bestsellers should be the focus of promotions and bundle deals.
✅ Capitalize on Weekend Demand: Offering weekend discounts or special deals could drive even more sales.
✅ Prepare for Seasonal Spikes: Running marketing campaigns before July and December could maximize revenue.
✅ Encourage Large Pizza Orders: Creating value deals for large-sized pizzas can further boost sales.GitHub Repository – View Full Analysis
STRIKERS PERFORMANCE PREDICTIONPython
PROJECT OVERVIEW
This project was an exciting deep dive into striker performance data, analyzing 500 players to uncover the key attributes that define top goal-scorers. Using Python for data cleaning, exploratory data analysis (EDA), and machine learning, I identified patterns in goal-scoring ability, dribbling success, movement off the ball, and overall contribution to classify strikers effectively.DATA CLEANING & PREPARATION
✅ Handled missing data – Filled gaps using the median for consistency.
✅ Converted data types – Ensured correct formats for analysis.
✅ Scaled numerical features – Standardized values for machine learning models.EXPLORATORY DATA ANALYSIS (EDA)
I visualized key metrics to understand player attributes and performance trends:
🌸 Pie Charts – Analyzed right-footed vs. left-footed strikers.
🌸 Count Plots – Compared strikers by nationality.
🌸 Scatter Plots – Examined relationships between hold-up play and consistency rate.STATISTICAL TESTS
📊 Pearson Correlation Test – Checked for strong relationships between key performance metrics.
📊 Linear Regression – Evaluated how hold-up play impacts consistency rate.MACHINE LEARNING MODELS
🌸 Feature Engineering: Created a Total Contribution Score to quantify overall striker effectiveness.
🌸 Label Encoding & Dummy Variables – Prepared categorical data for machine learning.
🌸 KMeans Clustering – Segmented strikers into performance-based clusters.
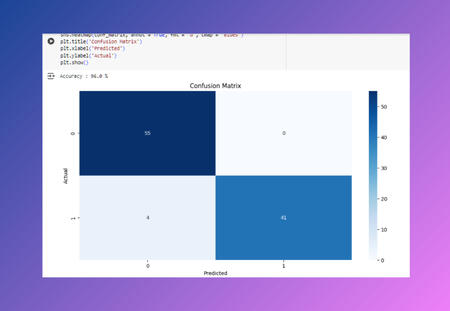
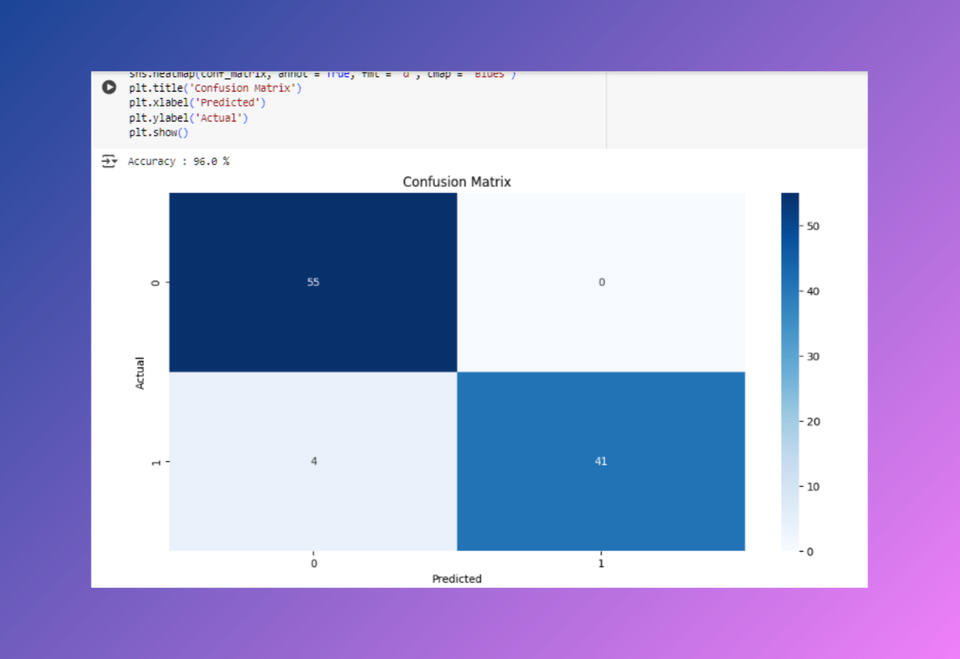
🌸 Logistic Regression (LGR) – Built a predictive model to classify strikers with accuracy.KEY INSIGHTS I DISCOVERED
📌 Hold-up play strongly influences striker consistency, making it a crucial skill.
📌 Strikers with high movement off the ball tend to have better goal-scoring efficiency.
📌 Top performers exhibit a balance of dribbling success, conversion rate, and defensive contribution.FINAL THOUGHTS
This project reinforced the power of data-driven scouting and performance analysis. By leveraging EDA and machine learning, I created a structured approach to identifying top strikers, offering valuable insights for coaches, scouts, and analysts.GitHub Repository – View Full Analysis
PERSONAL FINANCE TRACKERExcel
PROJECT OVERVIEW
We often hear “track your spending”, but it’s easy to get overwhelmed with numbers. So, I built a dashboard that makes it simple to see where money comes from, where it’s going, and what patterns are forming over time.This tracker was developed as part of a training led by Freedom Oboh on Excel dashboards. While balancing work and learning, I took my time to complete the project and I’m really glad I did.To do this, I used XLOOKUP to pull in customer details (like country and loyalty card status) and product attributes (coffee type, roast type, size, and price) into the Orders table. This gave me a complete view of each transaction, making analysis much smoother.TOOLS & FEATURES
✅ Microsoft Excel
✅ Pivot Tables for dynamic summaries
✅ Charts & Graphs for intuitive visualization
✅ Slicers for monthly filtering
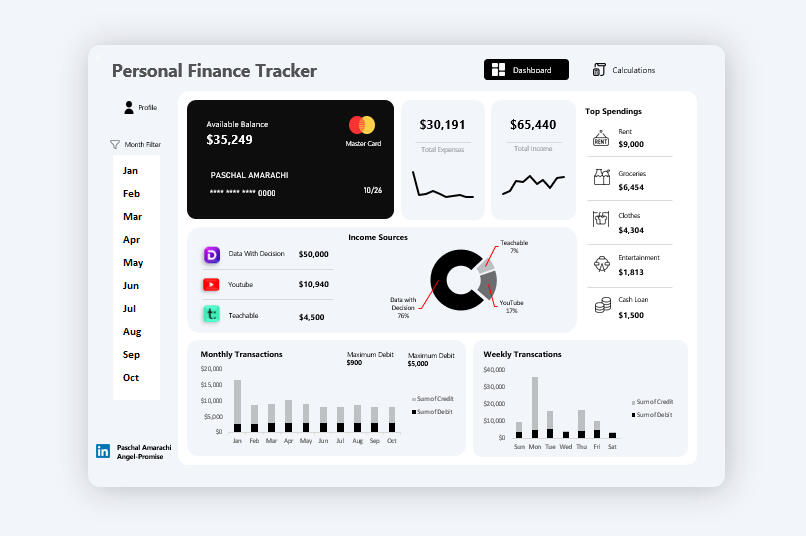
✅ Custom layout and formatting for a modern, user-friendly interfaceDASHBOARD DEVELOPMENT
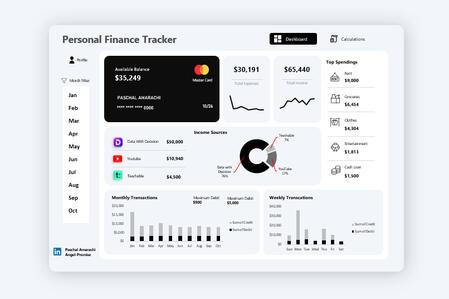
🌸 Available Balance
A quick overview of how much is left in the account.🌸 Total Income vs Total Expenses
Two clean line charts help visualize inflow vs outflow over time, a great way to understand how spending tracks against earnings.🌸 Income Sources Breakdown
Income is grouped into three main categories:
🔹 Data with Decision (freelance/contract)
🔹YouTube
🔹Teachable (online courses) This provides clarity on which source contributes the most, and it’s clear that Data with Decision makes up the bulk at 76%.
🌸 Top Spending Categories
Here’s where things get interesting:🔹 Rent takes up the largest chunk at $9,000.
🔹 Groceries and Clothes follow.
🔹 Entertainment and cash loans make up smaller but still notable amounts.
🌸 Monthly & Weekly Transactions
🔹 Monthly Chart: Shows how spending and credit activities evolve over the months.
🔹 Weekly Chart: Highlights heavy transaction days, in this case, Sundays seem to have the highest volume of credits.KEY INSIGHTS I DISCOVERED
📌 Income is strong, but spending on Rent and Groceries is significant. This shows stability but also the importance of budgeting around fixed costs.
📌 Entertainment and cash loans suggest some discretionary spending, this might be an area to trim if savings goals increase.
📌 Sundays are the biggest transaction days, this could indicate a weekly routine of transfers, subscriptions, or bulk shopping.
📌 Data with Decision is clearly the primary income source. It may be worth exploring how to scale or replicate that success in the other streams.WHAT I'D DO NEXT
✅ Set monthly saving goals after rent and groceries are covered — build a buffer.
✅ Explore scaling YouTube and Teachable revenue for more income diversity.GitHub Repository – View Full Analysis